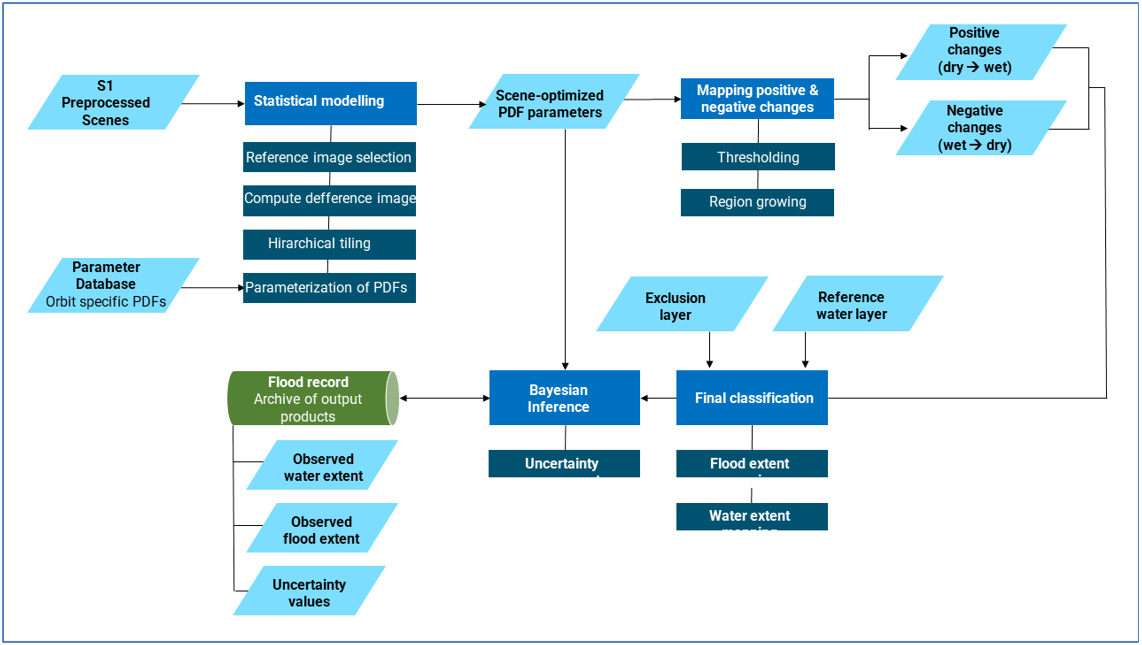
GFM flood mapping algorithm 1, which was developed by LIST, is a hybrid SAR-based flood mapping method that combines parametric thresholding, region-growing, and change detection to detect and map all increases and decreases of floodwater extent in the most recently recorded Sentinel-1 SAR scene with respect to a previously recorded overlapping Sentinel-1 SAR scene from the same orbit (i.e. the reference image).
The parameters of the two partially overlapping Gaussian probability distribution functions (PDFs) of backscatter values, representing flood and non-flood classes, are estimated using a hierarchical split-based approach (HSBA), which automatically identifies separate sub-regions (i.e. tiles) of variable size in a SAR image (i.e. single-date or change) that are characterized by histograms which are clearly bi-modal, normally distributed and well balanced.
The LIST algorithm takes as input the most recent SAR image and a reference SAR image, and computes a “change image” as the backscatter difference between the two images. Flooded pixels in the change image are expected to be positive because of the reduction of backscatter values caused by flooding. Since the input Sentinel-1 SAR image values (i.e. σ0 backscatter intensities in decibels) are already log-transformed, the change image is in effect a “log-ratio” image[1]. The log ratio method is widely used in change detection of multitemporal SAR amplitude or intensity images, as logarithmic transformation can not only transform the multiplicative noise (speckle) affecting SAR data into additive noise[2], but also compresses the range of variation of values and better balances these below and above one.
The four PDFs of backscatter values attributed, respectively, to water, no water, change, and no change, which are determined by the HSBA, are used to derive an optimal set of parameters for the subsequent sequence of adaptive thresholding and region growing processes. The region growing approach assumes that grid-cells constituting the target class are clustered rather than randomly spread out over the images. Application of the derived parameters to pairs of SAR images produces one map of floodwater appearing between t0-1 and t0, and another map of floodwater receding between t0-1 and t0. For the final classification, the flood extent map generated at t0-1 is updated with all appearing and receding floodwater computed at the previous steps, and taking account of the Reference Water Mask, the Exclusion Mask (including the Height Above Nearest Drainage or HAND layer), and the ocean mask from the Copernicus Digital Elevation Model (DEM).
The data processing workflow of the LIST flood mapping algorithm is shown in the following figure.

In a nutshell
- The LIST flood mapping algorithm is based on a scientifically validated and patented technology enabling a systematic, automatic and high-accuracy monitoring of water bodies using Sentinel-1 data. The algorithm uses a highly innovative sequence of hierarchical image splitting, statistical modelling, and region growing to delineate and classify areas that changed their flooding-related backscatter response between two image acquisitions from the same orbits.
- Further details are provided in the dedicated section of the Product Description Document (PDD)
[1] Based on the quotient rule for logarithms, i.e. log[x/y] = log[x] - log [y]
[2] Based on the product rule of logarithms, i.e. log[x.y] = log[x] + log[y]