¶ 6.1 The Global Flood Awareness System (GloFAS)
The Global Flood Awareness System (GloFAS) is the global flood service of CEMS, an operational system monitoring and forecasting floods across the world.
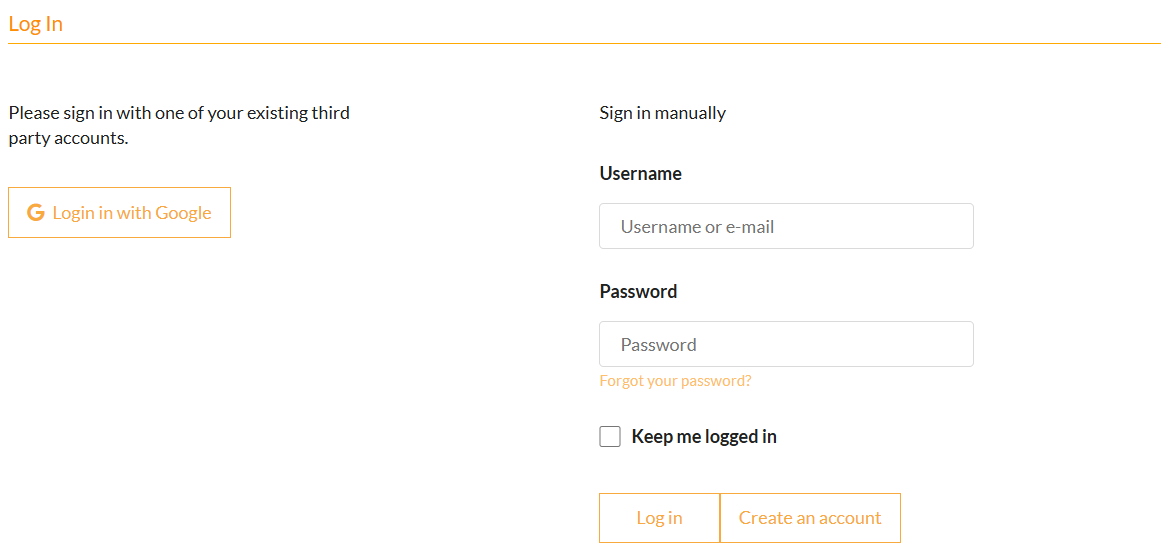
GFM output layers are made available within the GloFAS Map Viewer. In order to access the Map Viewer, users are requested to register to the service (right graphic below). Once registered, the Map Viewer can be accessed by typing the account details . As can be seen, users can also sign in to the Map Viewer by means of their Google accounts (left graphic below).
¶ 6.1.1 Monitoring the Health Status of the GFM Product
Information about the overall health state of the GFM product is presented to the user within GloFAS Map Viewer (left graphic below). An alert sign in the top menu (next to the user profile) indicates the health state of the service. The alert sign is colour coded as follows:
| Green: Service Up and Running | Amber: Service Degraded | Red: Service Not Available |
Detailed information about the health state of the various components of the GFM product are shown by clicking on the alert sign. This opens a pop-up window in the Map Viewer with the latest registered alert notifications (right graphic below). The different alert notifications are organised by “Group” providing details about the current “Status”, a “Message” describing the alert notification, and a “Date” indicating when the alert was raised.
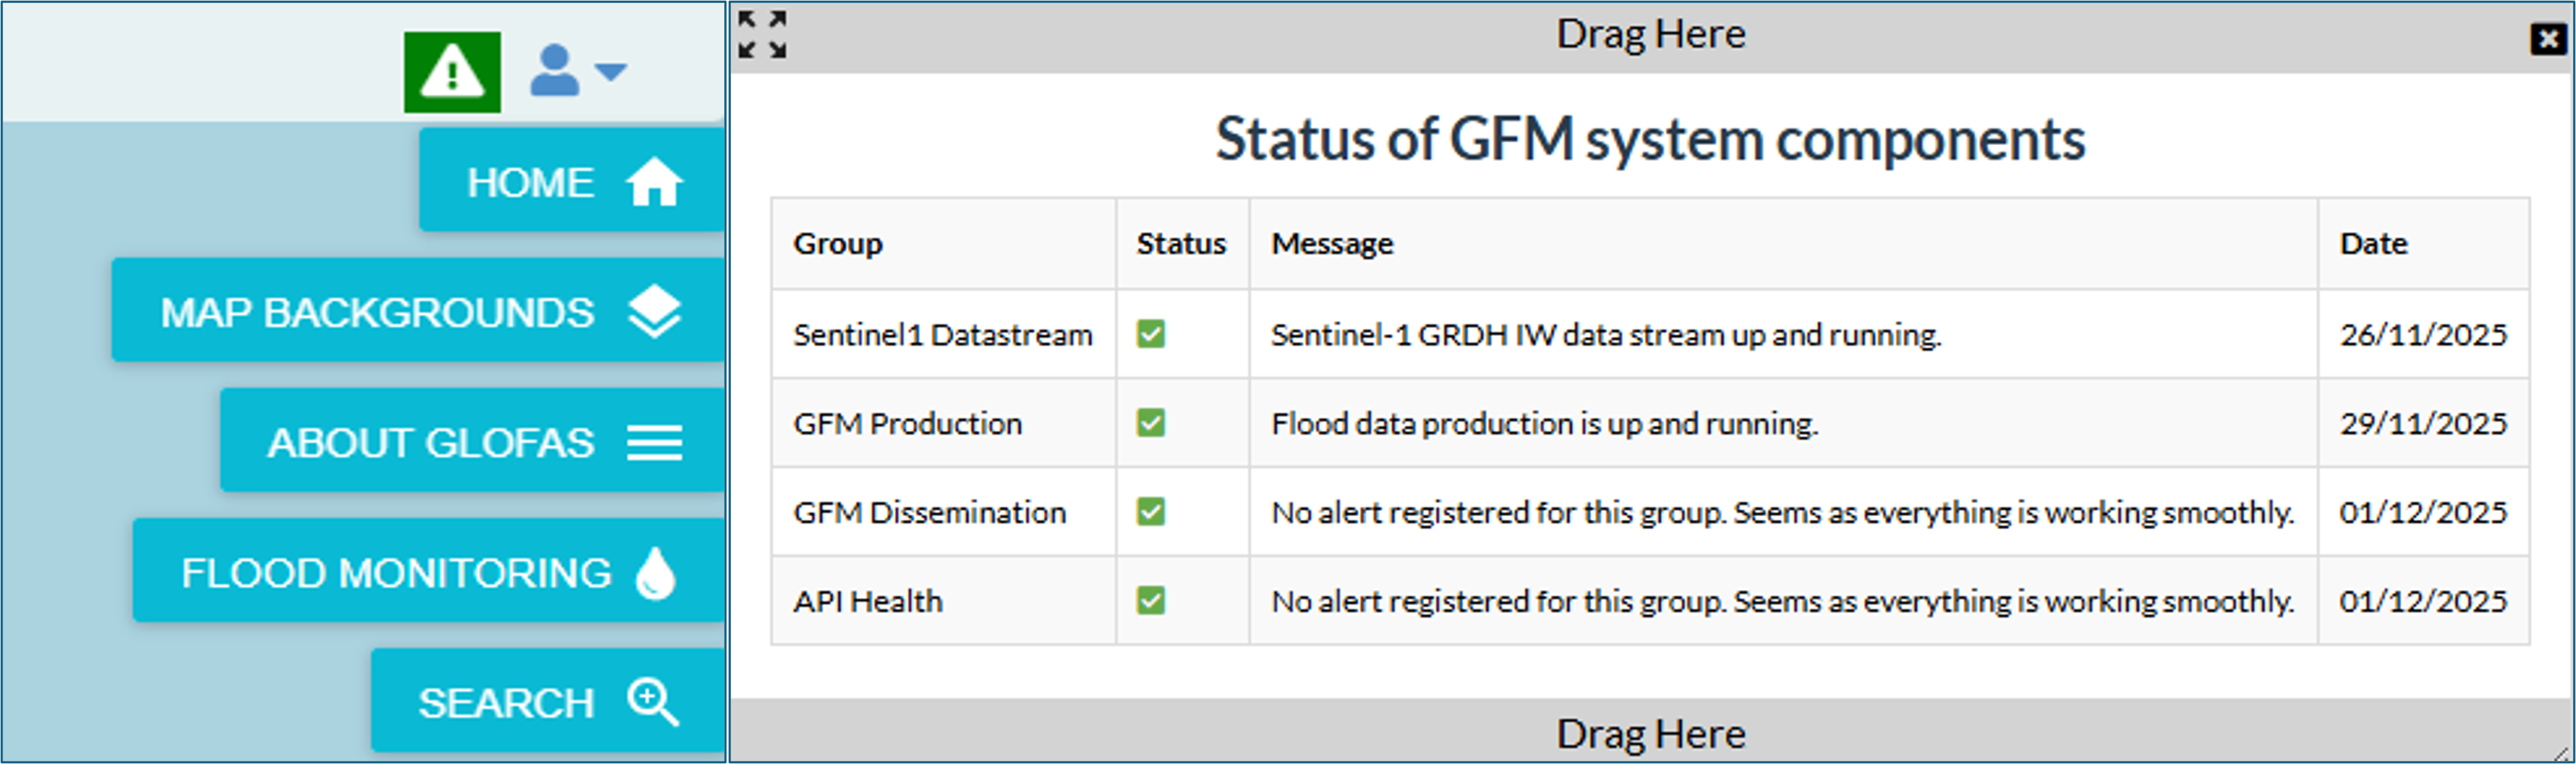
The column “Group” (right graphic above) refers to the individual components of the service. Four service components / groups are defined, as outlined below:
| Sentinel1 Datastream: |
|
| GFM Production: |
|
| GFM Dissemination: |
|
| API Health: |
|
¶ 6.1.2 How to browse GFM products in GloFAS Map Viewer
Once logged in, the GFM output layers are listed in the top bar under the “Monitoring” menu (left graphic below). Each layer can be visualized by moving the toggle to the “on” position. The selected output layer is then added to the dynamic layer list on the left side of the screen (right graphic below).
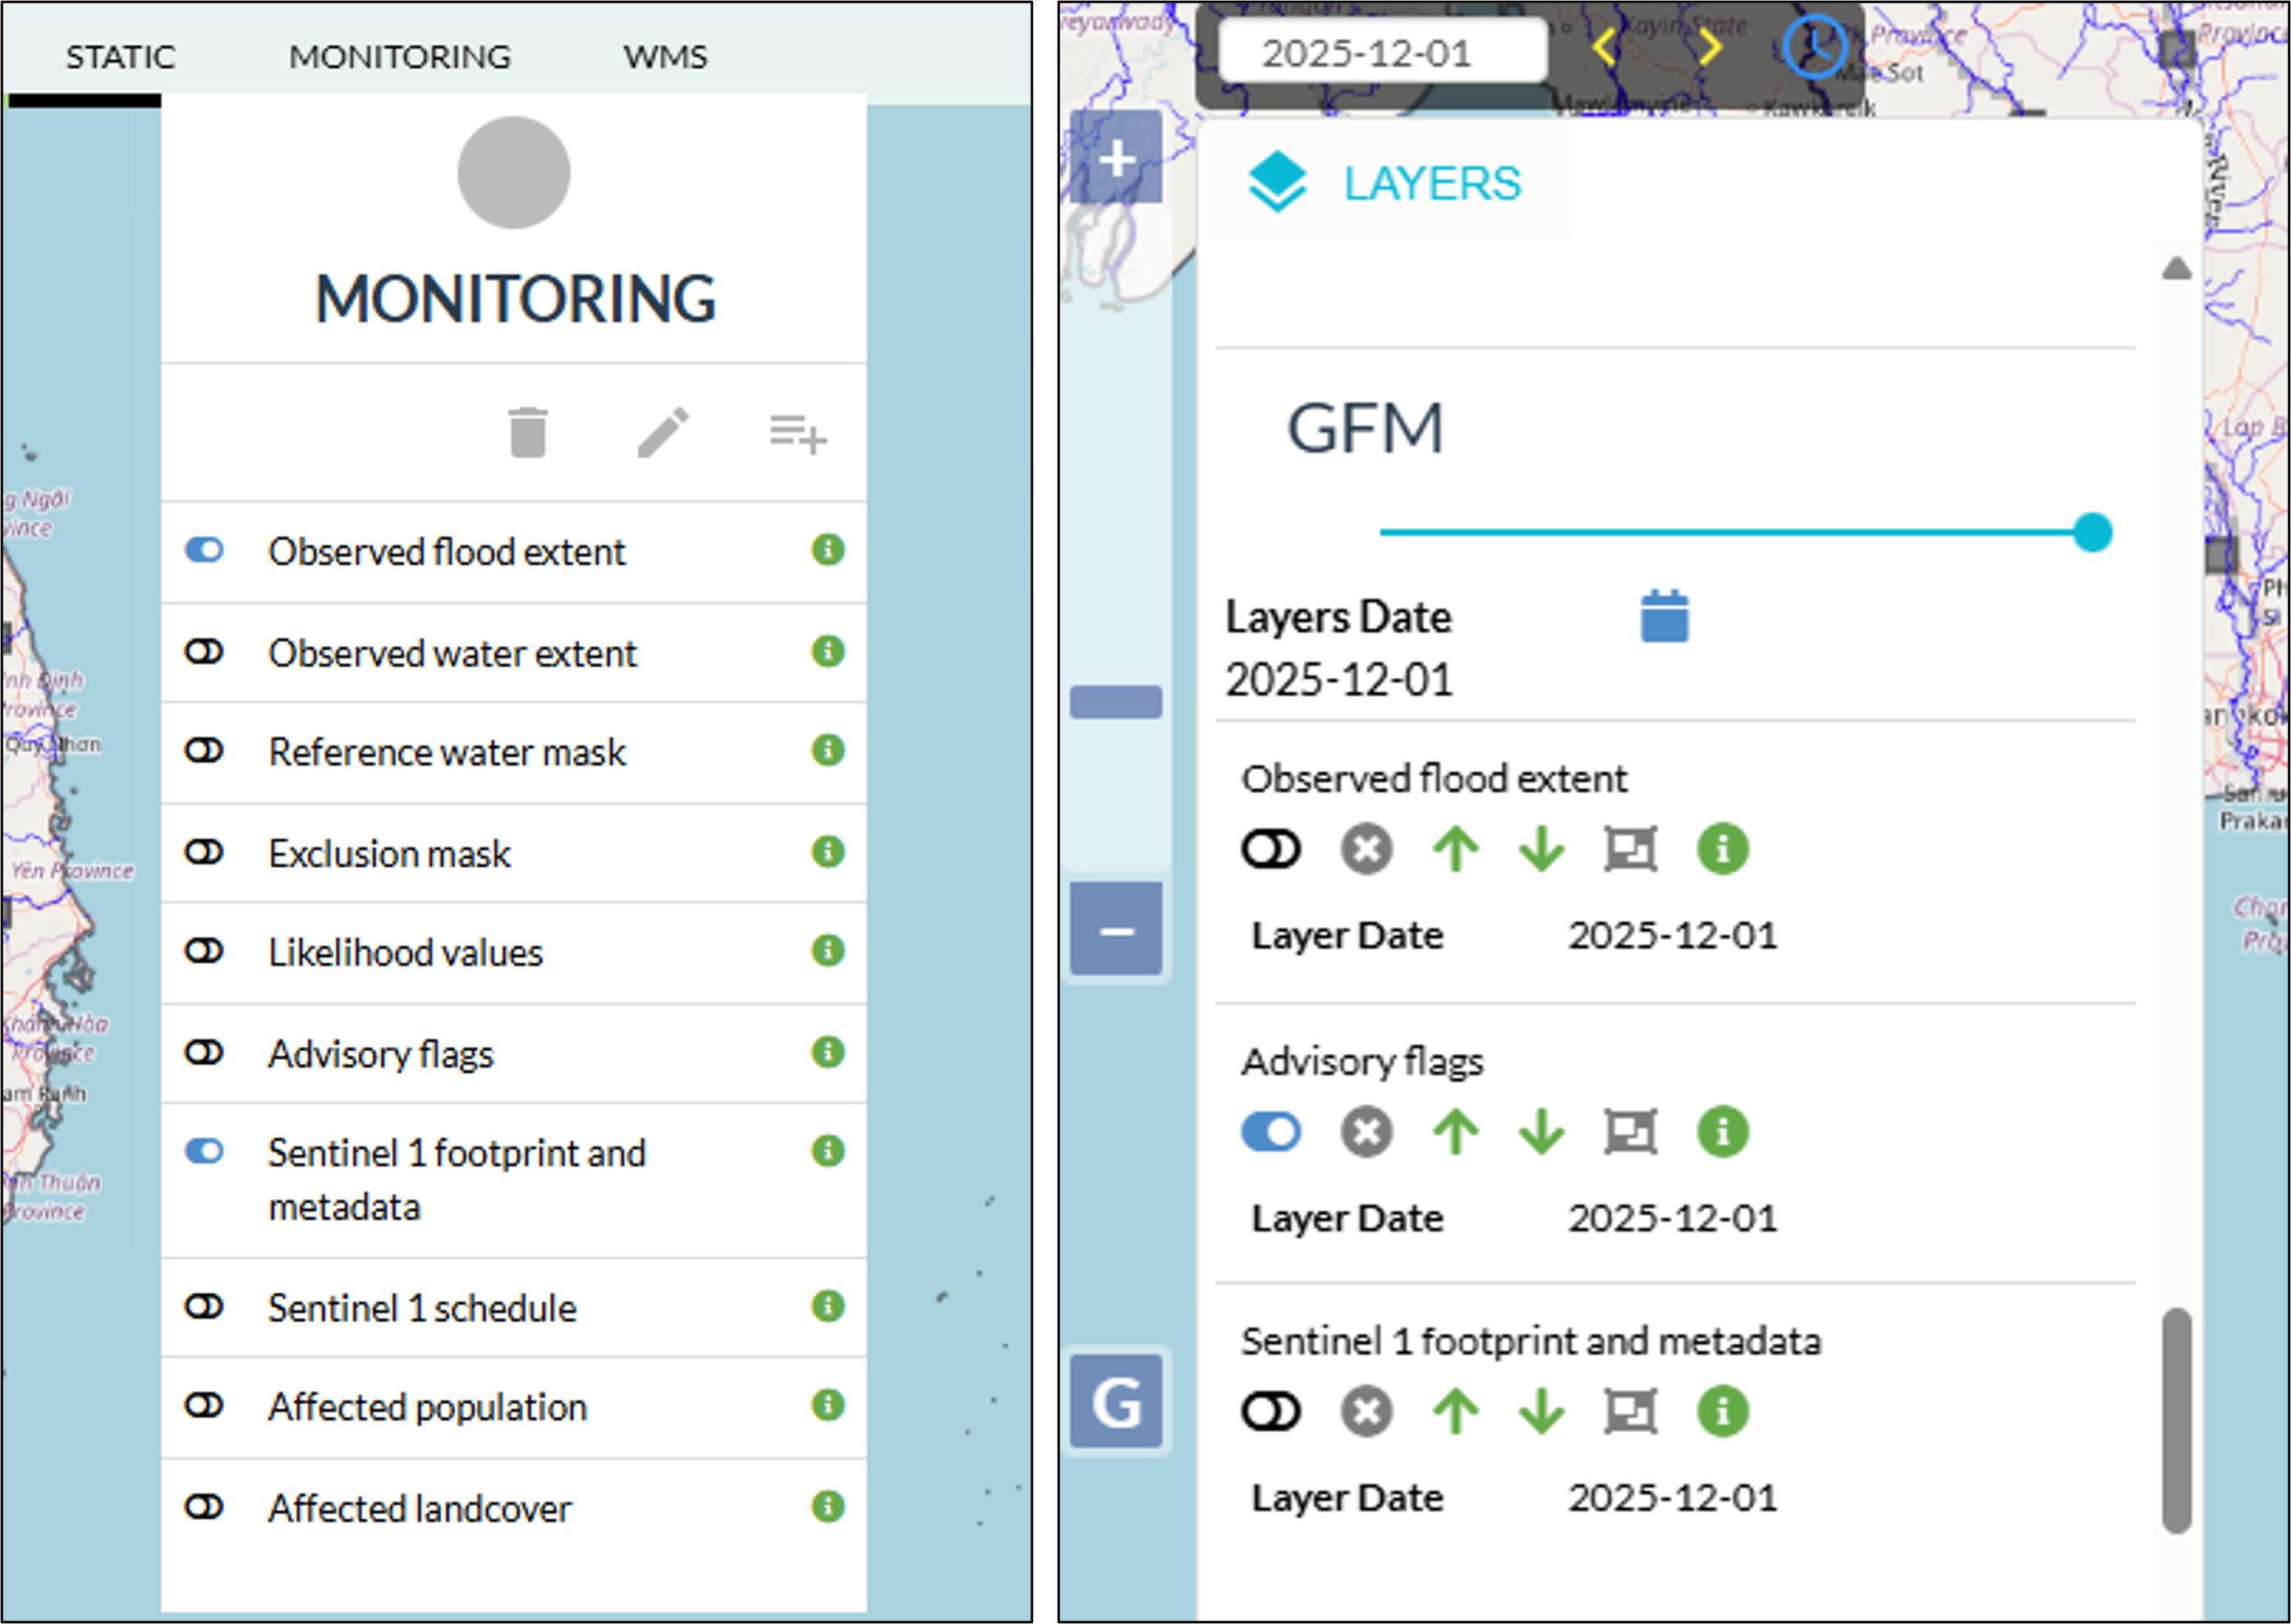
In the example below, the Observed Flood Extent layer is switched on. The GloFAS Map Viewer then displays the Sentinel-1 tiles for which GFM has detected flood-covered areas.
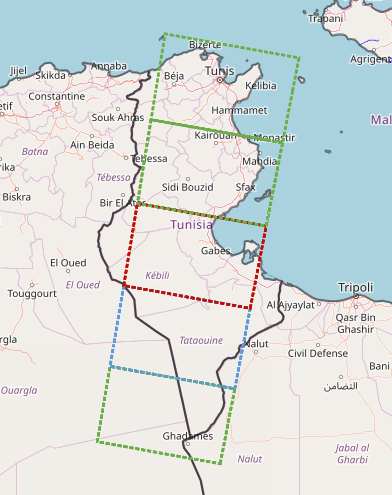
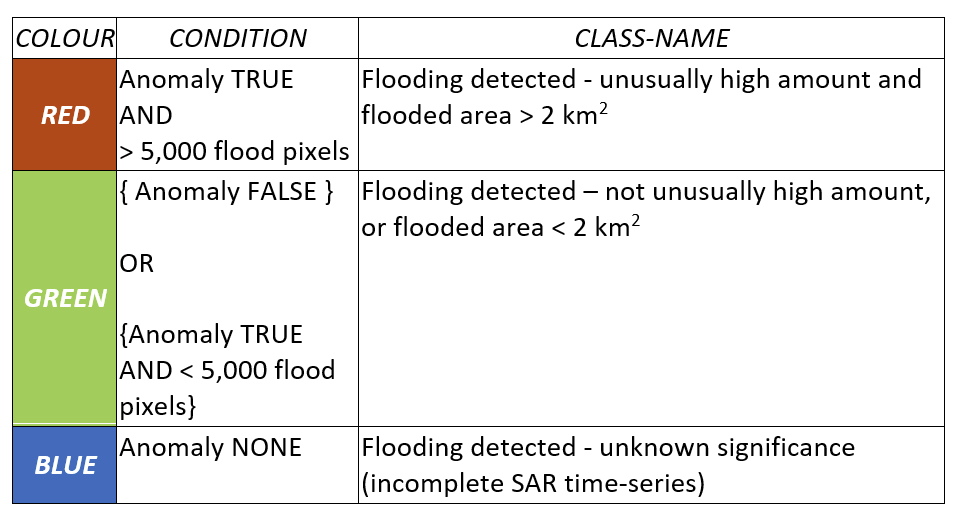
The dashed edge of each S-1 overpass tile is colour-coded according to the size and the pattern of the detected flooded, as shown in the legend below:
¶ 6.1.3 Areas of Interest
GFM-registered users can also draw their own areas of interest (AOIs), as explained below:
|
|
|
|
|
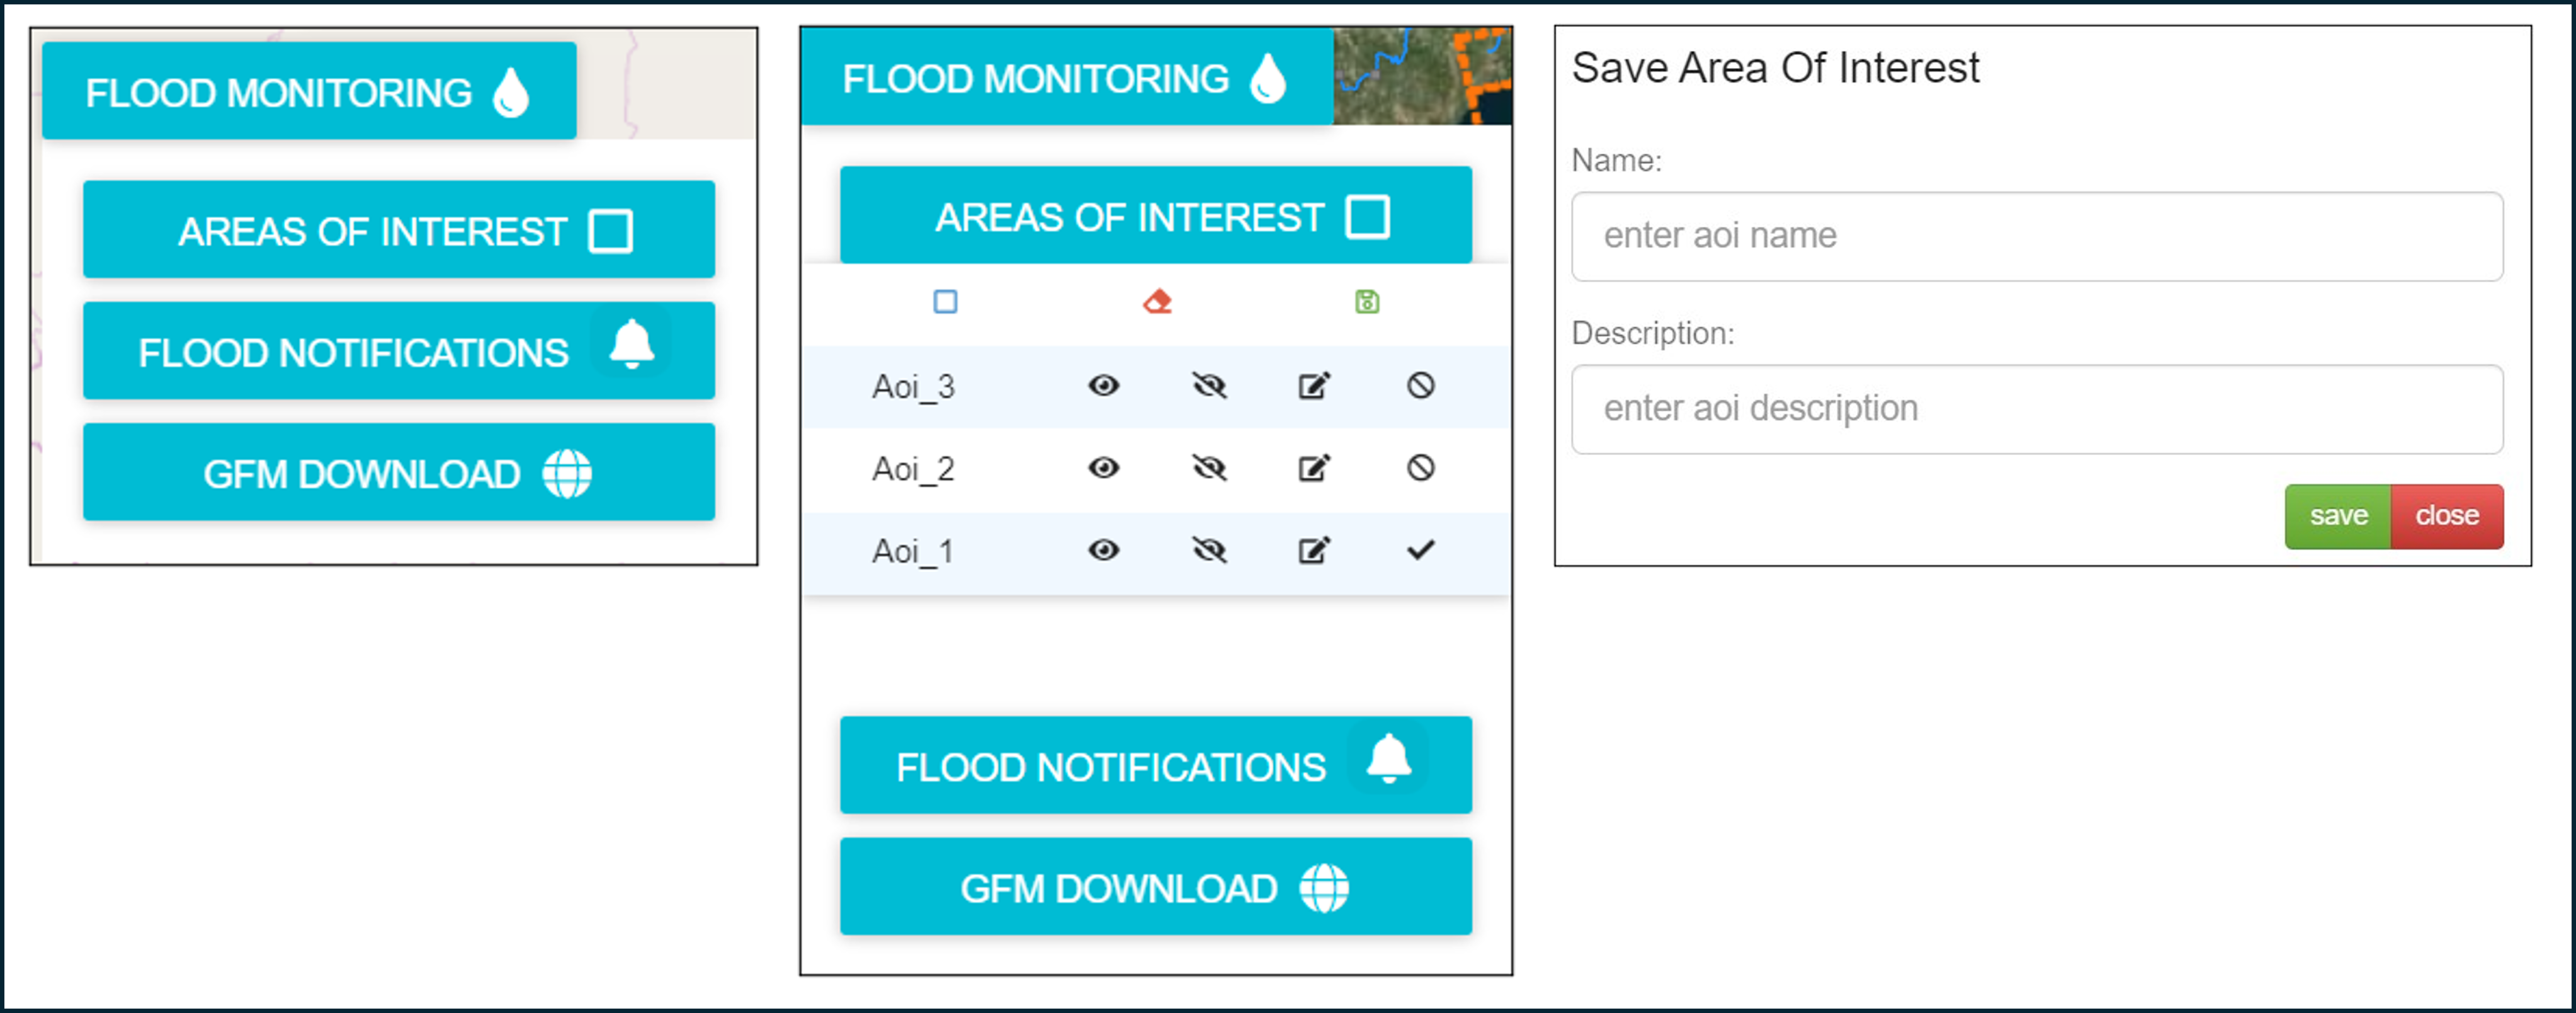
Please note that the maximum number of AOIs for each user is limited to 25. Once the limit is reached, a new AOI can be added only if one of the previous is deleted.
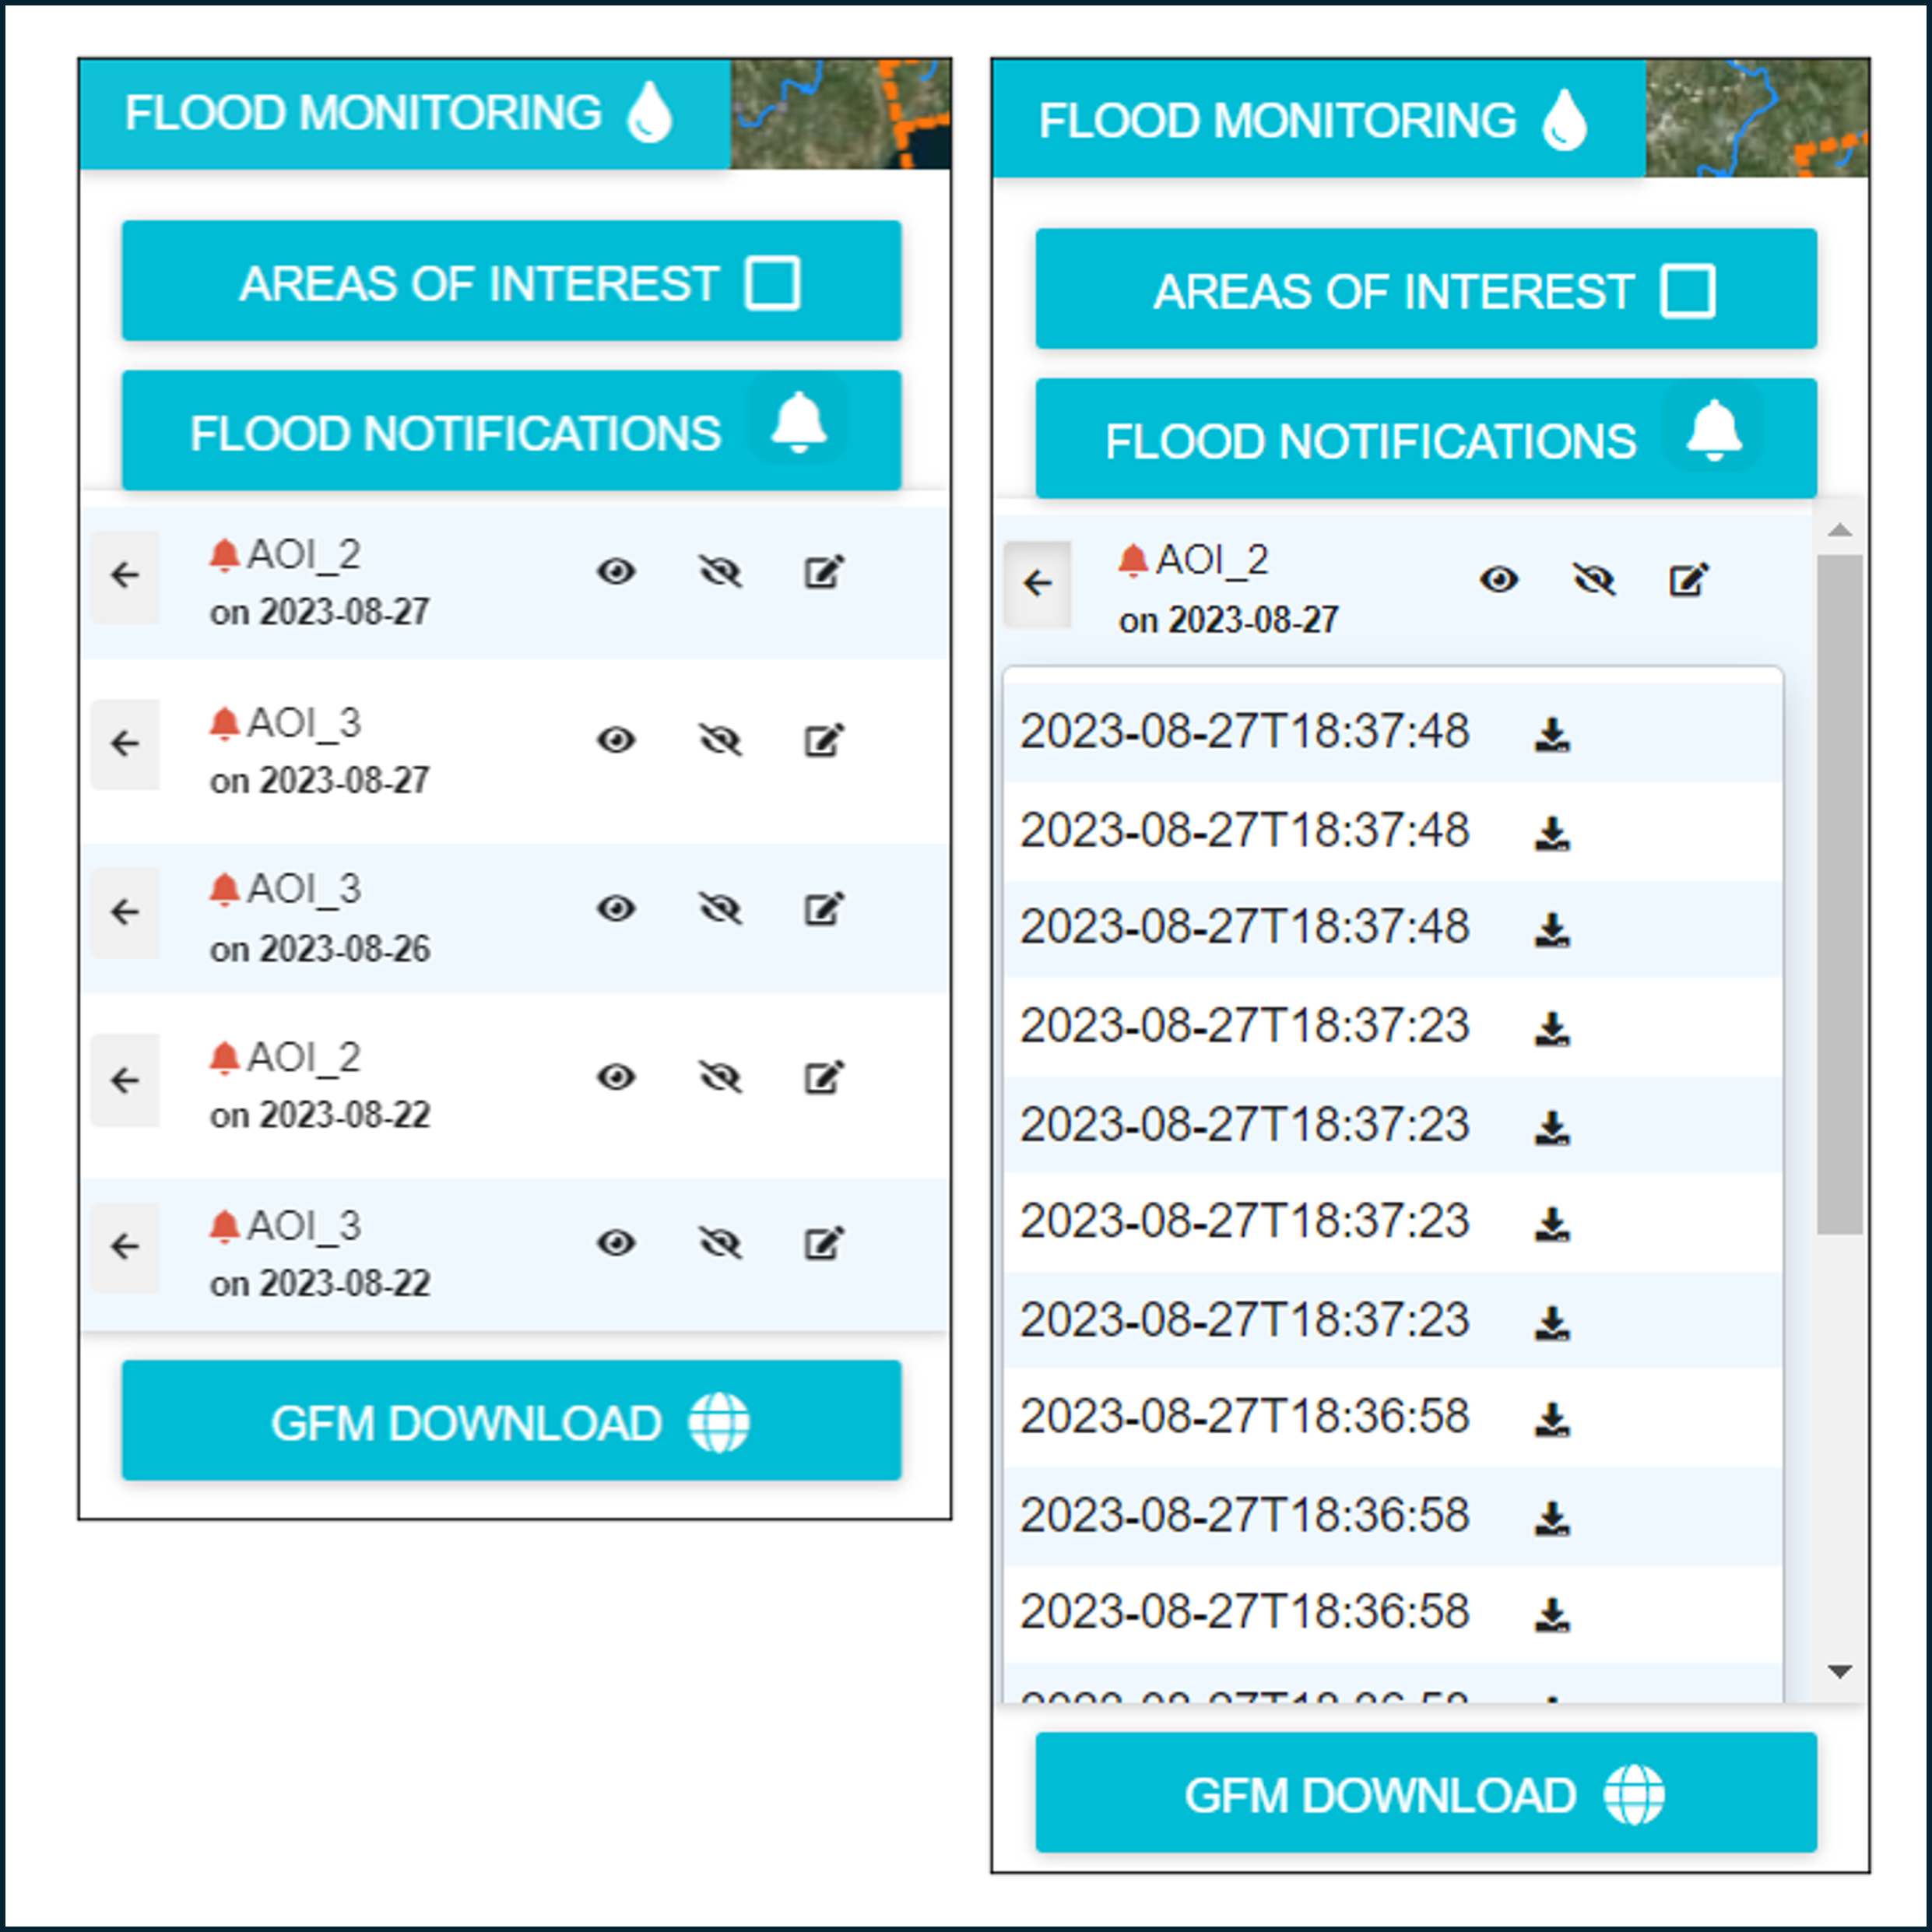
¶ 6.1.4 Floods notification
Users have the option to be notified any time a new GFM output layer is available for a specific AOI, on proper configuration of the notification setup through GFM Web Portal. Once done, flood notifications are displayed on GloFAS as well through the menu (left graphic below). When users click on a notification, the system will display every newly available output layer.
GFM output layers can then be downloaded in a bundle (.zip file) in TIFF format by pressing the down-arrow icon (right graphic below). By pressing GFM DOWNLOAD, the user is re-directed to the landing page of the GFM Web Portal.
Didn't find what you were looking for? Send us a message through the contact forms:
EFAS: https://european-flood.emergency.copernicus.eu/en/form/feedback [Flood Monitoring]
GloFAS: https://global-flood.emergency.copernicus.eu/contact-us/ [Satellite-based Global Flood Monitoring]